This how-to will describe how to configure Aptana Studio 3 on Windows with XAMPP and Xdebug to be able to debug PHP code.
Table of Contents
Enable Xdebug in apache
The first thing, that we should do is to enable Xdebug on XAMPP. For this we must edit the php.ini file that configurates the php module.
So we need the following configurations:
[XDebug]
zend_extension = "C:\xampp\php\ext\php_xdebug.dll"
xdebug.remote_enable = 1
xdebug.remote_handler = "dbgp"
xdebug.remote_host = "127.0.0.1"
xdebug.remote_port = 9000
xdebug.trace_output_dir = "\xampp\tmp"
xdebug.idekey = ECLIPSE_DBGP
Note:
zend_extension = "<the path MUST contain the drive letter>"
Restart apache server after this changes.
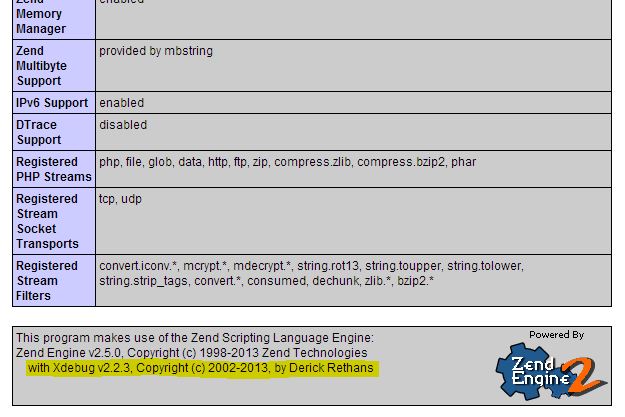
To proof the activation of Xdebug you can use the phpinfo() function (XAMPP has already the function for this on the main page).
The output should be looks like on the following image:
Configuration of Aptana Studio 3
Now we must configure our Aptana Studio to be able to debug PHP code.
XDebug
Go to Window -> Preferences -> Aptana Studio -> Editors -> PHP -> Debug -> Installed Debuggers
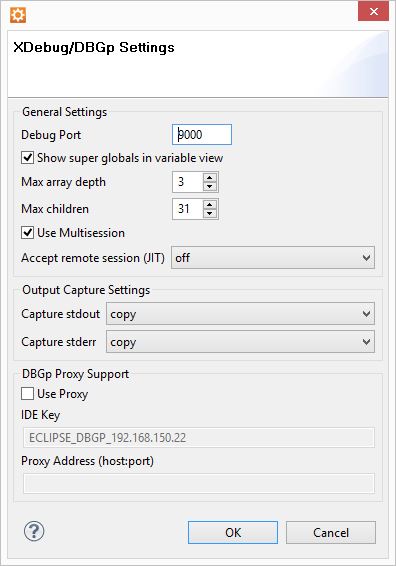
mark XDebug and click to Configure
Now set the following settings in the configuration dialog:
PHP Interpreter
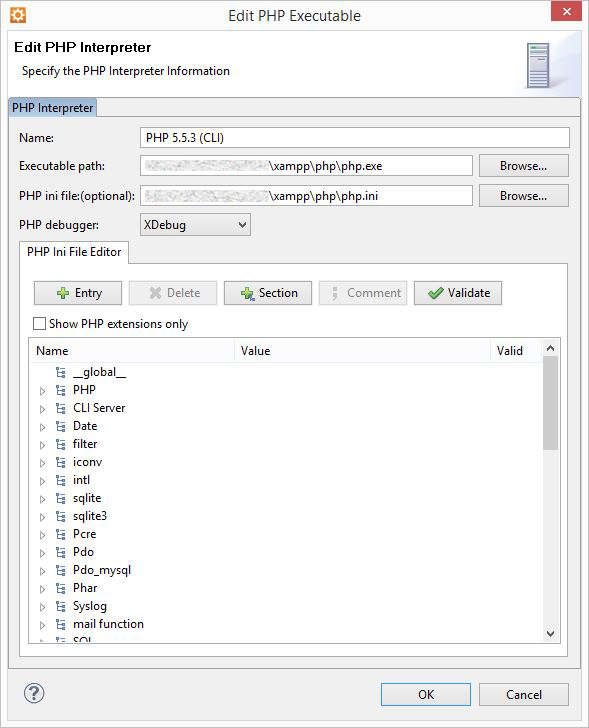
The next step is to add the PHP interpreter to Aptana.
Go to Window -> Preferences -> Aptana Studio -> Editors -> PHP -> PHP Interpreters
Now click to Add… and set the following settings:
Debug PHP Web Page
Now you can create the Debug launch configuration.
Go to Run -> Debug Configurations and add a new PHP Web Page with settings like following:
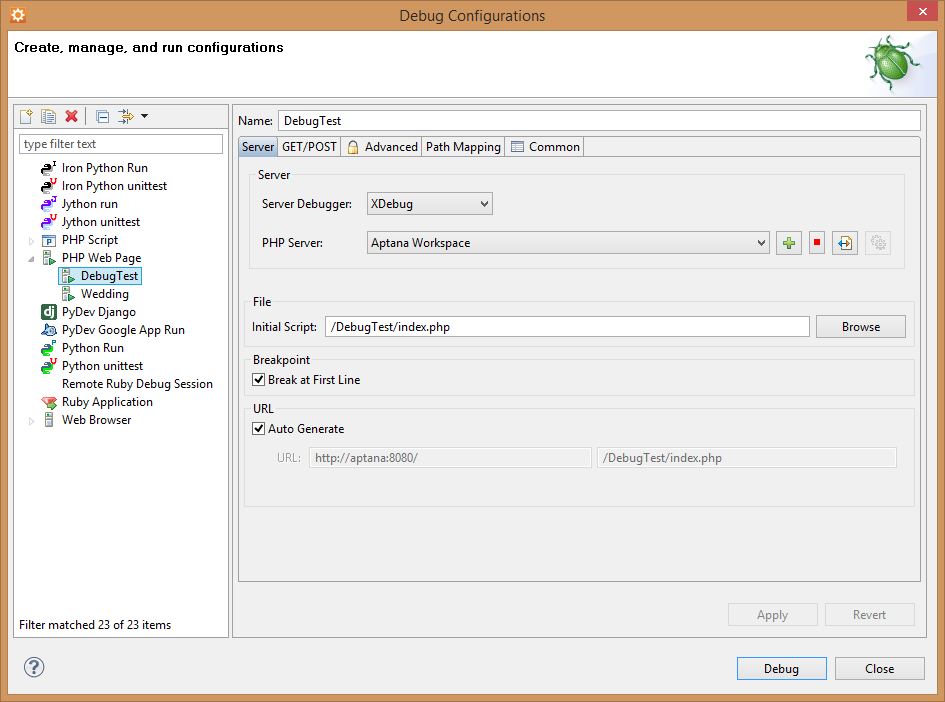
Now you should be ready to debug some PHP code.
Have Fun.